Introduction to R Shiny Dashboarding
June 25–27, AMMnet Senegal Workshop
🎯 Session Objectives
Understand key elements of Shiny Dashbaords
Gain hands on experience customising Shiny dashbaords
We can’t cover all aspects of creating Shiny Dashboards but there are a tonne of great resources online we will share during the course of today!
What is a Dashboard?
- A dashboard is a visual interface for exploring and interacting with data.
- In public health, dashboards help turn raw data into insights.
- Shiny lets you build dashboards directly in R — no web development needed!
📊 You’ve probably seen dashboards used in the COVID-19 response - what other dashboards can you think of?
Why Use Shiny?
✅ Turns R code into interactive web apps
✅ You don’t need to learn HTML, CSS, or JavaScript
✅ Great for sharing visualizations, tables, and summaries
✅ Easy to deploy: share with collaborators or host online
✅ Allow non R users to interact and explore data without the need to code.
✅ Provide analytical capacity to people without analytical skills
✅ Shiny is a lot more flexible that DHIS2 modules
Challenges
🛑 Need an R coding background
🛑 Can be more complext than normal R scripts
🛑 Can be costs to hosting apps for distribution
Examples of Dashboards
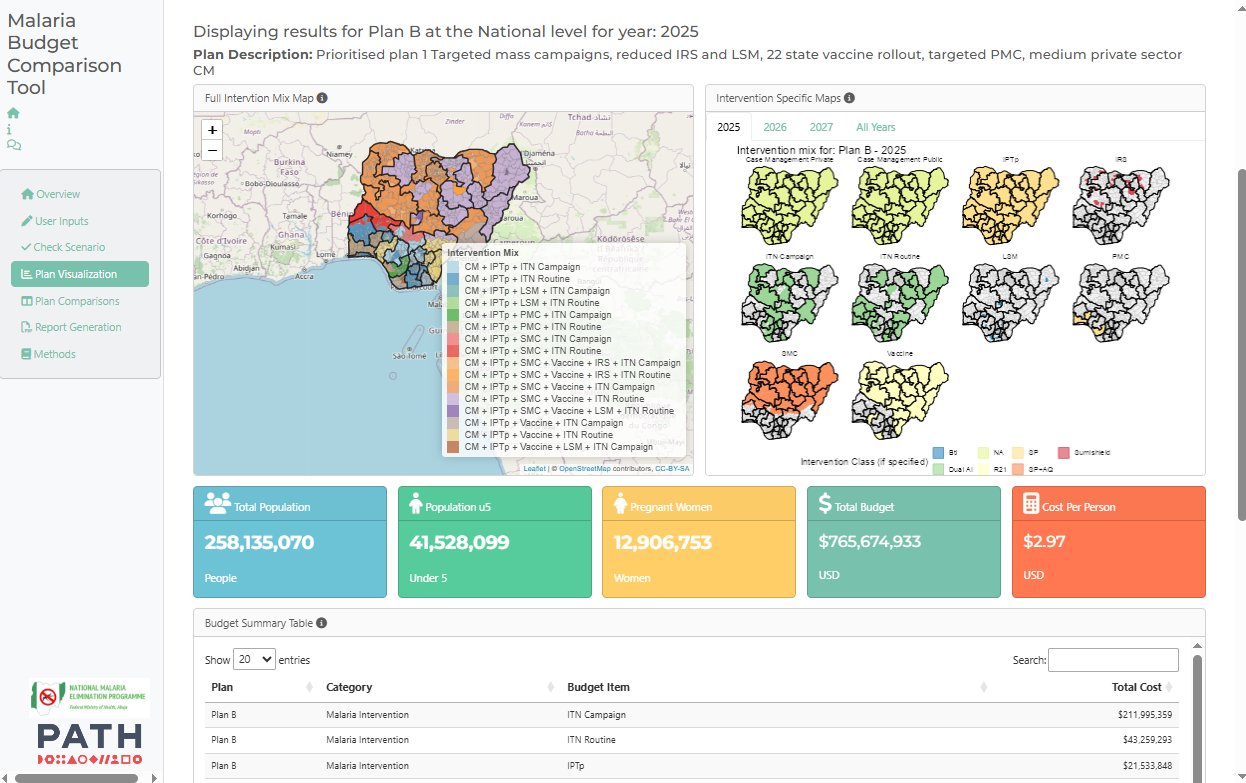
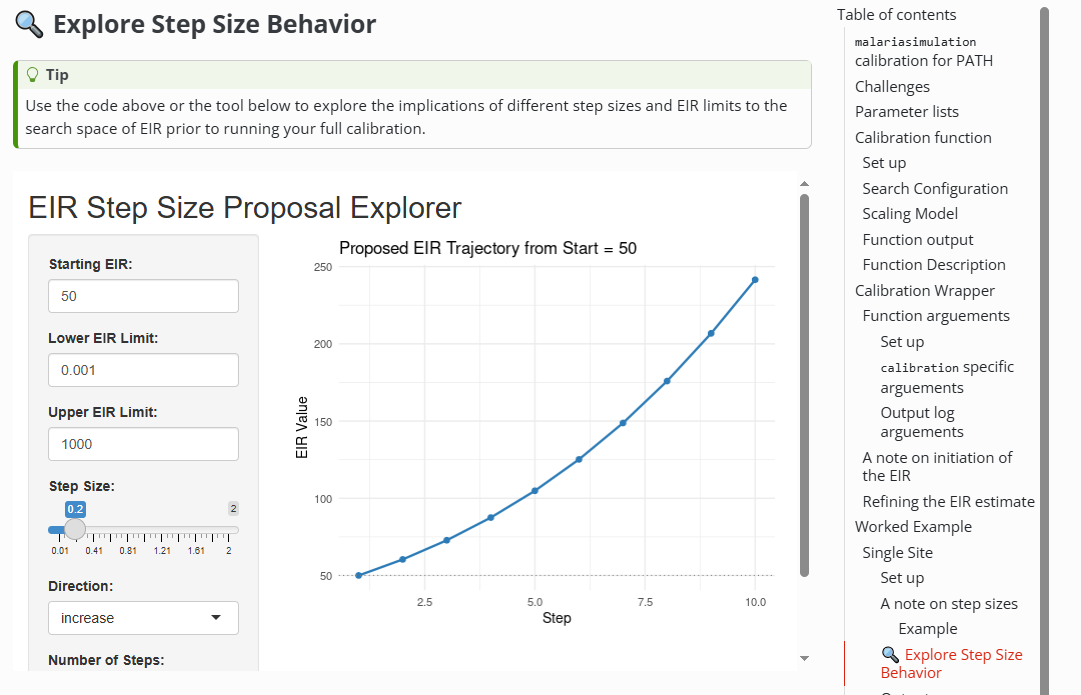
Shiny dashbaords can grow to be incredibly complex web applications but can also be small simple tools designed to help colleagues with everyday tasks and problems. Here are two examples of dashboards we’ve created recently at PATH.
🎨 Theming
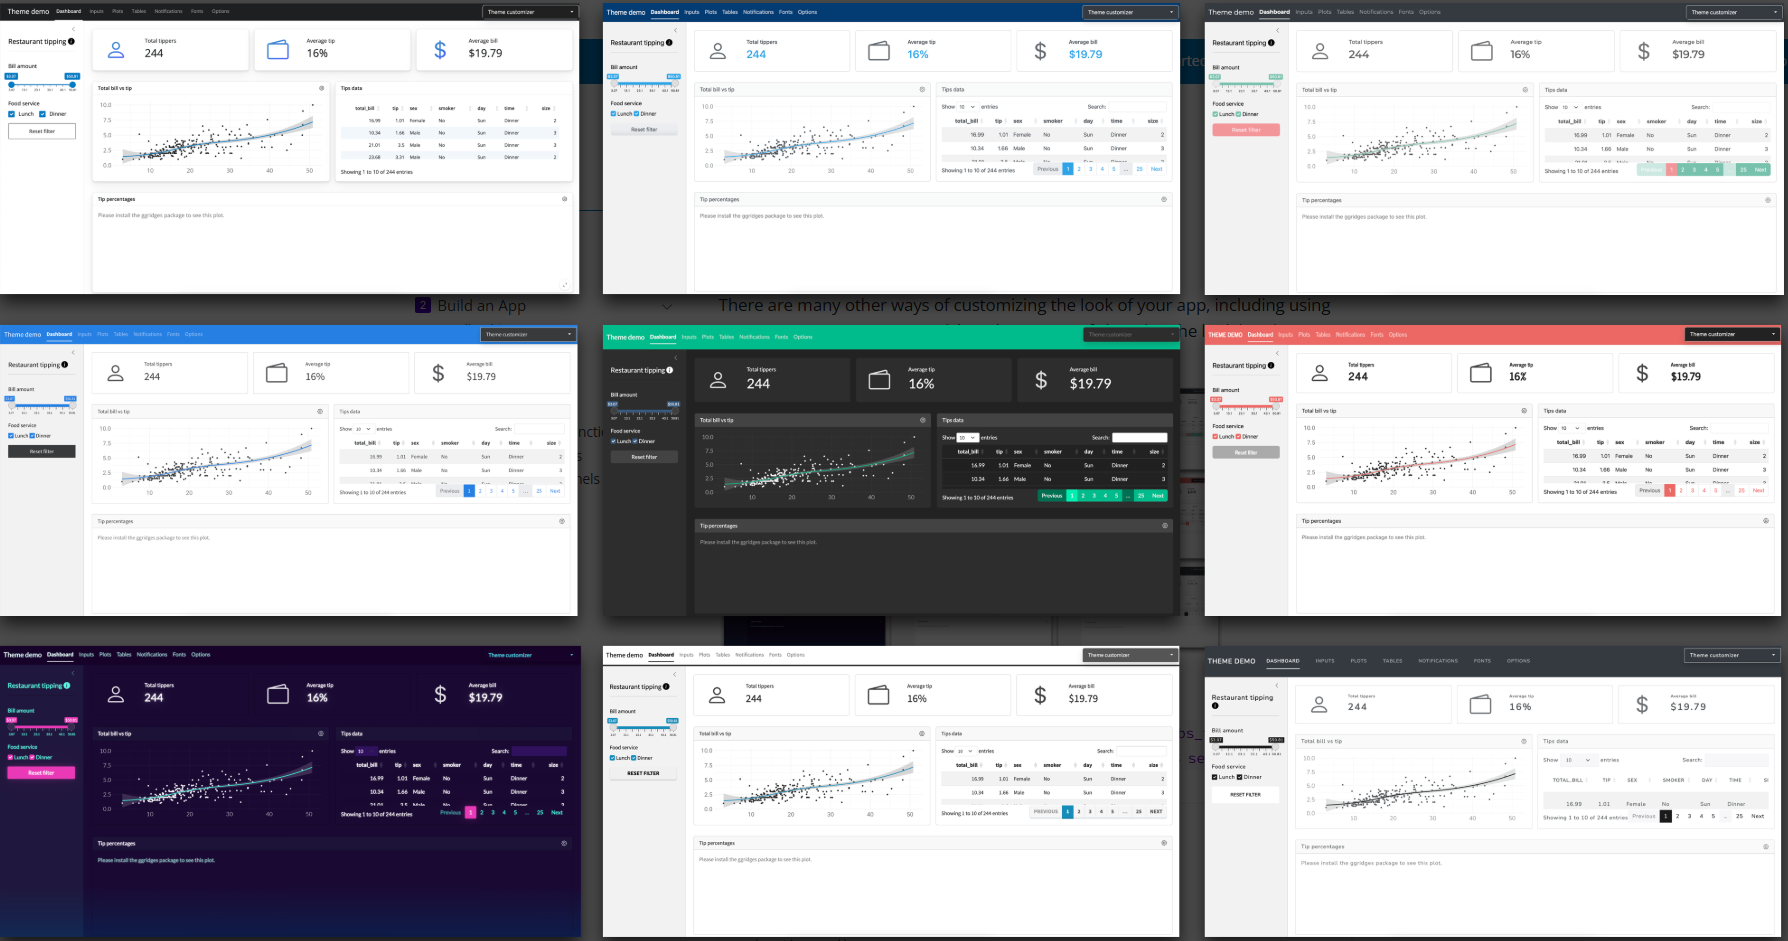
Customizing the theme of your dashboard is a really simple way to upgrade the look and feel of your app.
You can use the {bslib} package to easily:
Change colors, fonts, and spacing
Apply modern Bootstrap themes (like flatly, minty, cosmo)
Preview changes live while building your app
We’ll explore this in more detail later — for now, just know it’s easy to give your dashboard a polished, professional look!
📦 Helpful Packages
shiny – the core package
bslib – for modern dashbaord design
tidyverse – for data wrangling
DT – for interactive tables
plotly – for interactive plots
leaflet - for open source interactive maps
🌐 Helpful Webpages for Getting Started with Shiny
Below are some beginner-friendly resources to help you dive deeper into Shiny:
These links are a great place to start exploring after today’s session.
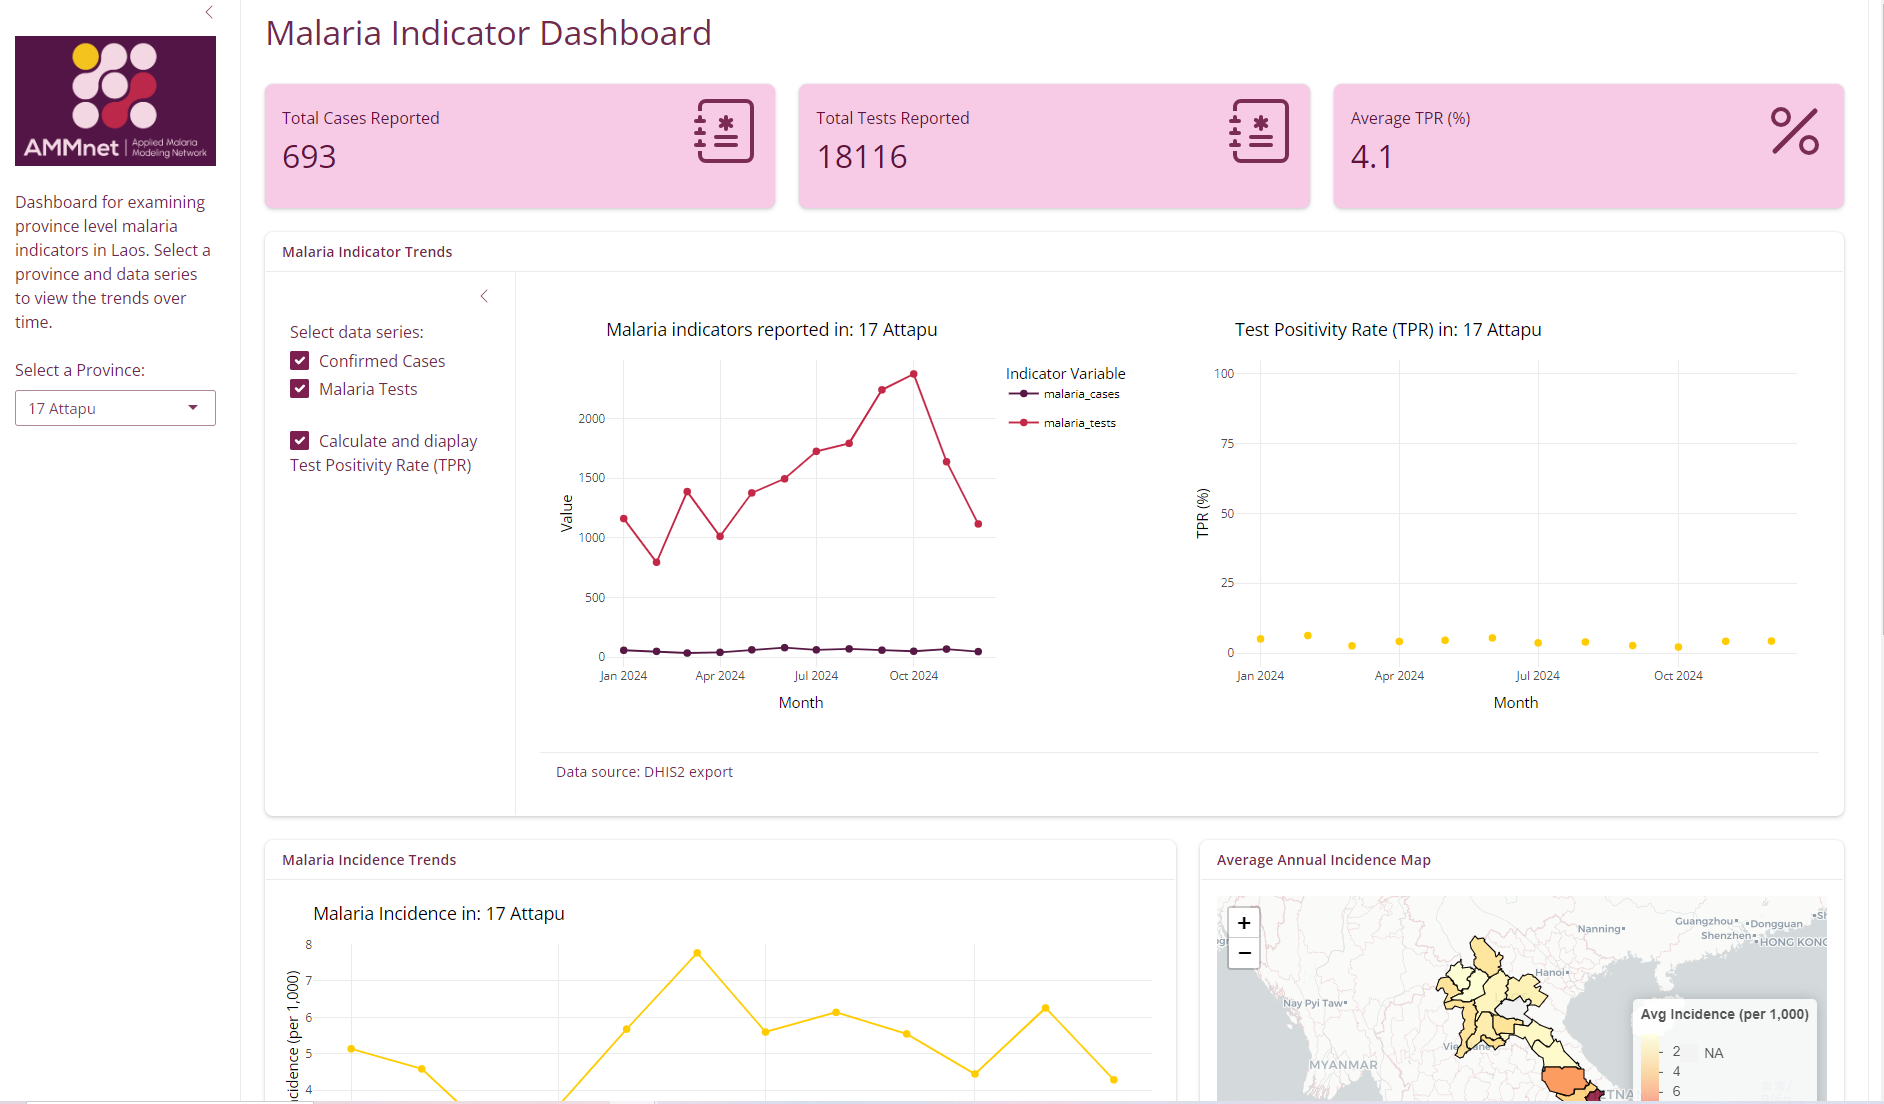
What You’ll Build Today: An R Shiny dashboard to visualize routine malaria data
Key Takeaways
Shiny makes dashboards easy to build in R
You’ll learn by doing — today is all about hands-on practice
You’ll work with a template and build out each element of the dasboard
We’ll go step-by-step 🛠️
Instructions
Follow the link to the materials worksheet - open in google chrome for auto translate.
Work through each section and complete the exercises as you go.
Reach out for help or to ask questions!
Enjoy!!
Example Finished Dashboard
![]()