library(tidyverse)
library(lubridate)5 Understanding Error Messages in R Part 2
In the previous chapter we learned about the causes of some of the most common error messages that you are likely to see when coding in R. We saw examples of misspellings, capitalization issues, closing punctuation errors, continuing punctuation errors, filepath issues, and unloaded libraries. Each of these essentially caused the same fundamental problem, R was looking for something that wasn’t there.
We also touched on the fact that, no matter how much instruction we go through together, there are always going to be unfamiliar errors at some point in your work that we won’t have discussed. So, what do we do now? If we know we can’t cover all the error types, what is the point? Well, we can’t cover each error individually, but now that you know some of the most common errors, we can learn how to problem solve for unfamiliar errors in a systematic way.
5.1 Consulting Doctor Google, PhD
When you see an unfamiliar error, the first thing to do is to look for the common errors that we discussed last time. Look for misspellings, unclosed brackets, or unloaded libraries. These are often the answer to errors like “this object or function isn’t found/doesn’t exist”. However, sometimes we get totally unfamiliar errors that aren’t solvable by simple fixes we already know.
In these cases, it is not unusual to feel some amount of terror, rage, or despair. Luckily, Dr. Google can help you with these feelings. It is important to remember that, even when you are coding on your own, there is always a vast and thriving community of researchers on the internet who have likely encountered your problem before. We will learn how to tap into that resource today by googling a problem in our code.
First, let’s load our practice data
case_data2 <- readRDS("data/case-data-2.rds")This comes in as the same format that we usually see with the “district-cases-long.csv” dataset that we use for training. Let’s try to reproduce the plot we have previously made, tracking cases over time by district in Eastern Province.
case_data2 %>%
  filter(province == "Eastern") %>%
  ggplot(aes(x = period, y = count, color = district)) +
  geom_line()
`geom_line()`: Each group consists of only one observation.
ℹ Do you need to adjust the group aesthetic?When we try to make our plot, we get a blank plot along with the warning message “geom_path: Each group consists of only one observation. Do you need to adjust the group aesthetic?”
This is strange because we haven’t called group_by() anywhere in our code, so why is it asking about the group aesthetic? I don’t think anything is misspelt, and I don’t think we are calling on any functions or data that don’t exist. If we are unsure what the problem is, this is a good time to try to google an unfamiliar error.
5.2 How to Google Effectively
This may not seem like a critical or difficult skill, but putting the right information into google is more important, and more difficult, than you might think. The first thing to do is to copy the error message into google directly, usually with some designation that you are searching for R-related responses, rather than STATA/Excel/MatLab/GIS/any other computing service.
If we paste “R geom_path: Each group consists of only one observation. Do you need to adjust the group aesthetic?” into google, you will see a number of possible websites to check. Usually, the best website for R help on error messages is the top hit, “stackoverflow.com”.

This is an online forum where thousands of R users (and users of other computing services) post questions and answers about code every day, and it is a free resource that we can use without setting up an account! Eventually, we will want to learn how to directly post questions onto the stackoverflow website, but for now, let’s see if somebody has already answered our question (hint: Somebody usually has). Let’s check the first question/answer.
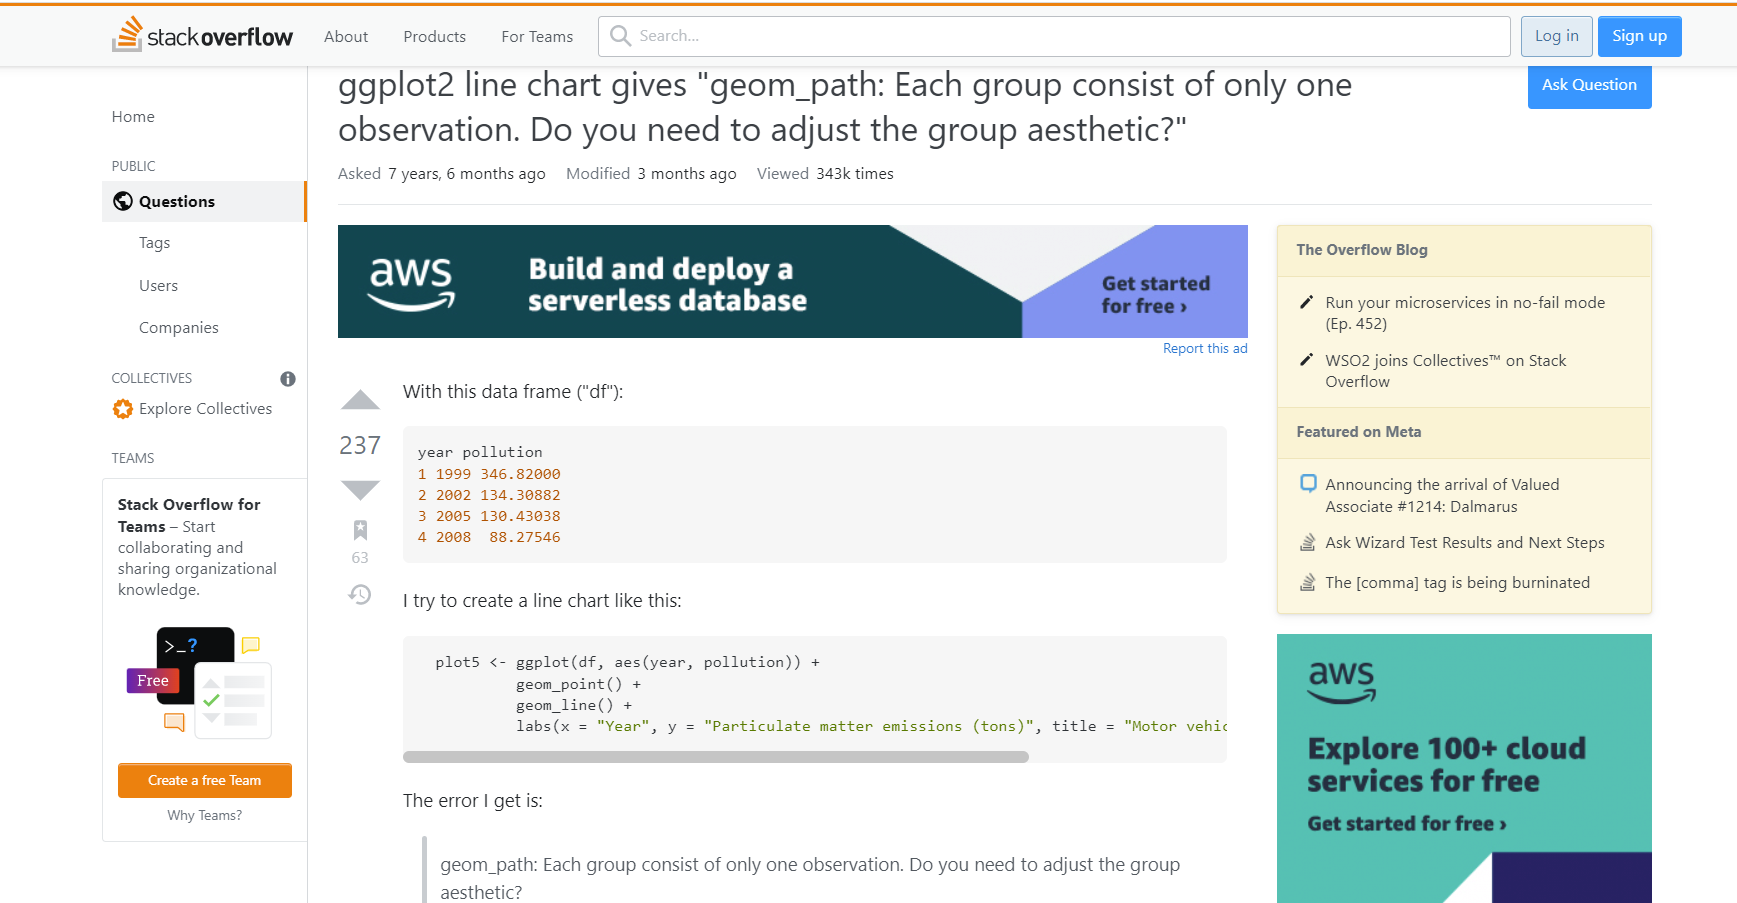
Stack overflow is structured so that the question asked is always the top of the page, with the user’s original question/data examples below. If you scroll down to the bottom of the question, you should see answers (usually sorted by highest score, see the upvotes on the left). What we want to do is to find the solution posted, and see if incorporating that in our code fixes our problem.
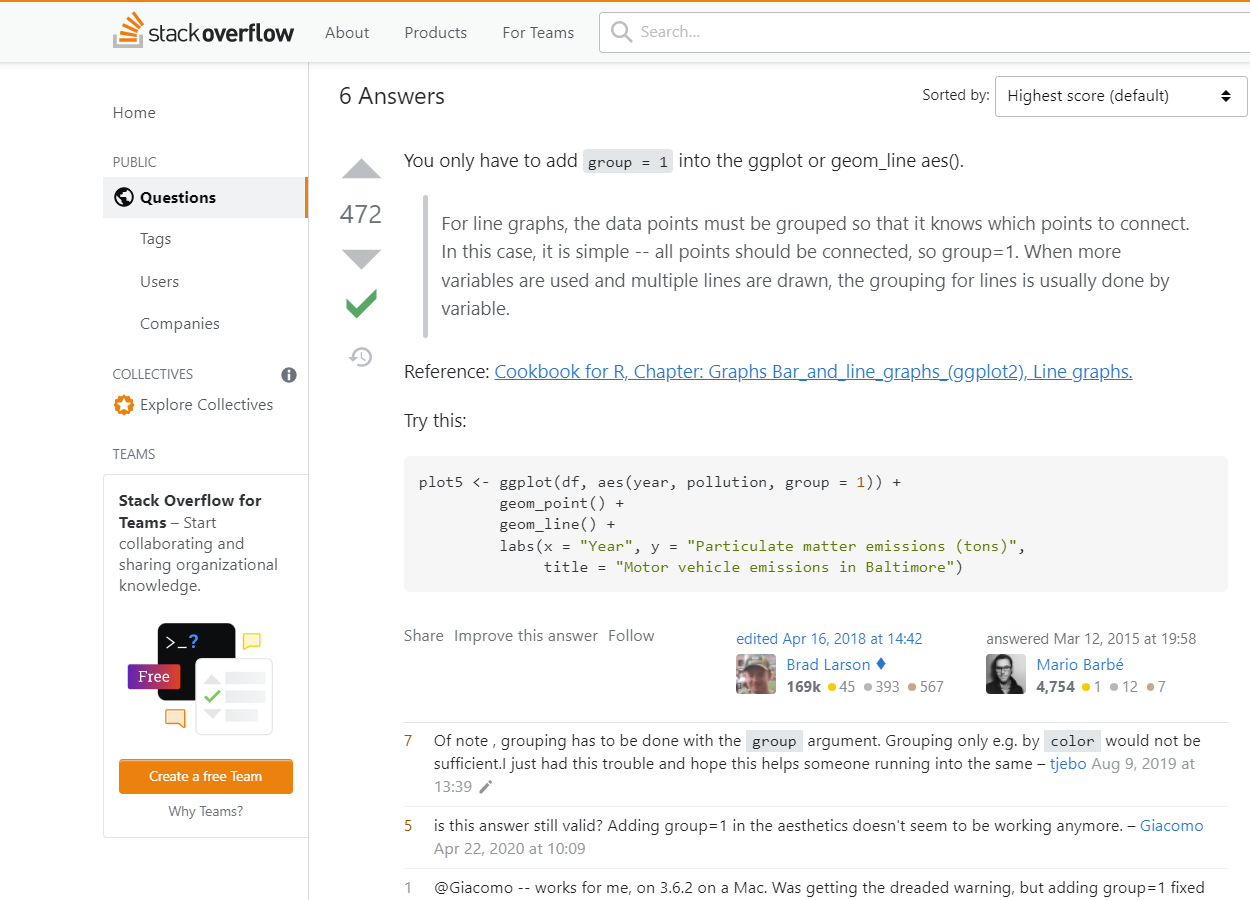
The only downside to lots of people asking detailed R questions is that sometimes the answers given pertain more directly to the other person’s work (that originally asked the question) than they do to ours. In this case, the question/answer for this first link don’t really help us all that much. If we add group = 1 inside our aesthetic call, we aren’t getting what we want.
case_data2 %>%
  filter(province == "Eastern") %>%
  ggplot(aes(x = period, y = count, color = district, group = 1)) +
  geom_line()
Seeing as that didn’t really work, let’s try another similar link. Back on the google results page, the second option (which is usually related to the first suggested link) has a different idea.
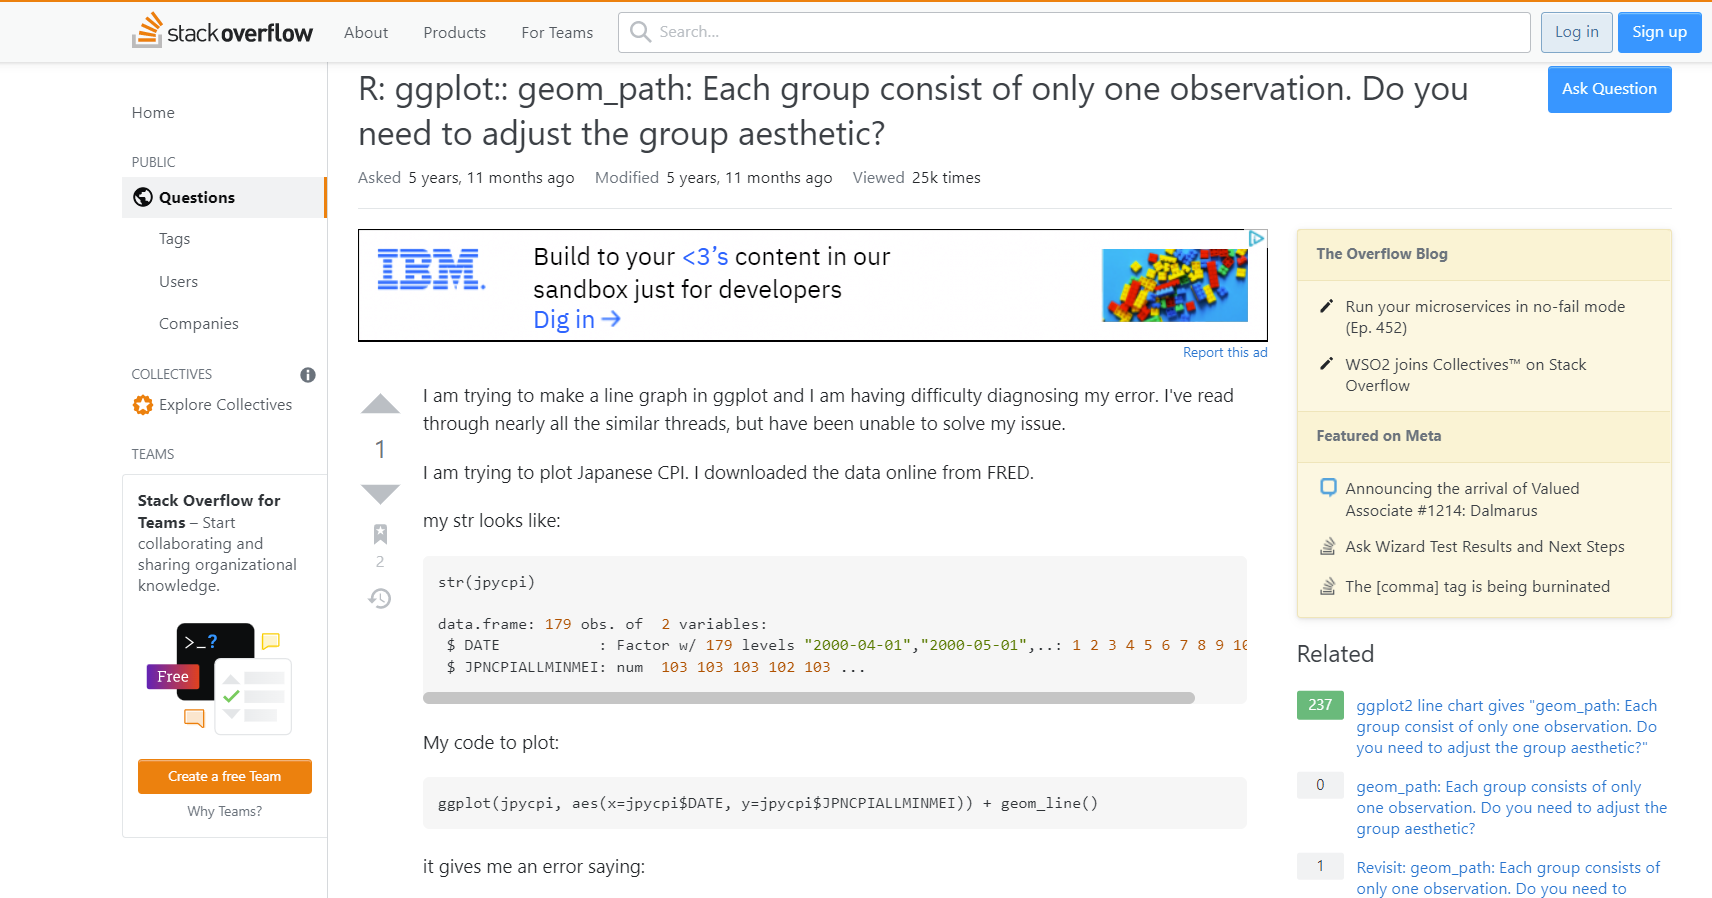
The question is still only tangentially related to what we are doing, but now they are working with a Date field that is similar to our period.
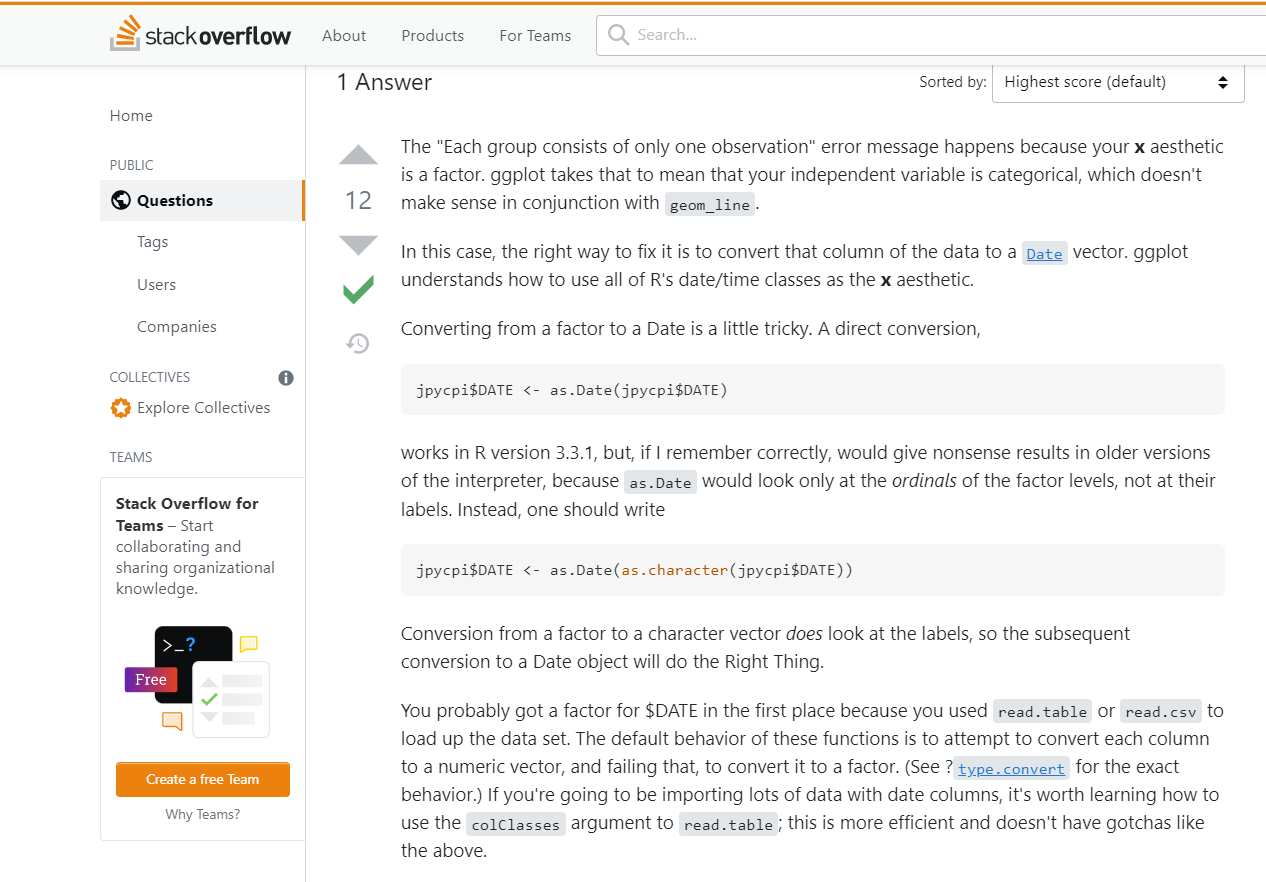
It looks like this question asker had a problem with their date field being the wrong Class of variable, and they got the same error that we did. Let’s look to see what field our period column is using the class function.
class(case_data2$period)[1] "character"This is our problem. Normally, our period column should read in as a class “Date” variable. Because we are trying to plot a character vector on our x-axis, we are having some problems. The question online had a similar issue, but they were using a “Factor” variable and converting that to Date. We want to just convert a character to a date, so we can skip the first part of their solution, and just use the as.Date() function on our period column in the aesthetics call. Let’s try that.
case_data2 %>%
  filter(province == "Eastern") %>%
  ggplot(aes(x = as.Date(period), y = count, color = district)) +
  geom_line()
And that fixes the problem! We can now track cases over time visually with one line per district.
This was an example of how we would effectively consult google to solve an unfamiliar error problem. It is also a reminder that it is always a good idea to check the structure of our dataset to see what class of variables our columns are. You can do this when you load in a dataset, either using the str() function on the whole dataset, or using the class() function on a single variable.
str(case_data2)rowws_df [5,252 × 5] (S3: rowwise_df/tbl_df/tbl/data.frame)
$ X : int [1:5252] 1 2 3 4 5 6 7 8 9 10 ...
$ period : chr [1:5252] "2018-01-01" "2018-01-01" "2018-01-01" "2018-01-01" ...
$ province: chr [1:5252] "Central" "Central" "Central" "Central" ...
$ district: chr [1:5252] "Chibombo" "Chisamba" "Chitambo" "Itezhi-tezhi" ...
$ count : num [1:5252] 1923 2192 6044 1786 3632 ...
- attr(*, "groups")= tibble [5,252 × 1] (S3: tbl_df/tbl/data.frame)
..$ .rows: list<int> [1:5252]
.. ..$ : int 1
.. ..$ : int 2
.. ..$ : int 3
.. ..$ : int 4
.. ..$ : int 5
.. ..$ : int 6
.. ..$ : int 7
.. ..$ : int 8
.. ..$ : int 9
.. ..$ : int 10
.. ..$ : int 11
.. ..$ : int 12
.. ..$ : int 13
.. ..$ : int 14
.. ..$ : int 15
.. ..$ : int 16
.. ..$ : int 17
.. ..$ : int 18
.. ..$ : int 19
.. ..$ : int 20
.. ..$ : int 21
.. ..$ : int 22
.. ..$ : int 23
.. ..$ : int 24
.. ..$ : int 25
.. ..$ : int 26
.. ..$ : int 27
.. ..$ : int 28
.. ..$ : int 29
.. ..$ : int 30
.. ..$ : int 31
.. ..$ : int 32
.. ..$ : int 33
.. ..$ : int 34
.. ..$ : int 35
.. ..$ : int 36
.. ..$ : int 37
.. ..$ : int 38
.. ..$ : int 39
.. ..$ : int 40
.. ..$ : int 41
.. ..$ : int 42
.. ..$ : int 43
.. ..$ : int 44
.. ..$ : int 45
.. ..$ : int 46
.. ..$ : int 47
.. ..$ : int 48
.. ..$ : int 49
.. ..$ : int 50
.. ..$ : int 51
.. ..$ : int 52
.. ..$ : int 53
.. ..$ : int 54
.. ..$ : int 55
.. ..$ : int 56
.. ..$ : int 57
.. ..$ : int 58
.. ..$ : int 59
.. ..$ : int 60
.. ..$ : int 61
.. ..$ : int 62
.. ..$ : int 63
.. ..$ : int 64
.. ..$ : int 65
.. ..$ : int 66
.. ..$ : int 67
.. ..$ : int 68
.. ..$ : int 69
.. ..$ : int 70
.. ..$ : int 71
.. ..$ : int 72
.. ..$ : int 73
.. ..$ : int 74
.. ..$ : int 75
.. ..$ : int 76
.. ..$ : int 77
.. ..$ : int 78
.. ..$ : int 79
.. ..$ : int 80
.. ..$ : int 81
.. ..$ : int 82
.. ..$ : int 83
.. ..$ : int 84
.. ..$ : int 85
.. ..$ : int 86
.. ..$ : int 87
.. ..$ : int 88
.. ..$ : int 89
.. ..$ : int 90
.. ..$ : int 91
.. ..$ : int 92
.. ..$ : int 93
.. ..$ : int 94
.. ..$ : int 95
.. ..$ : int 96
.. ..$ : int 97
.. ..$ : int 98
.. ..$ : int 99
.. .. [list output truncated]
.. ..@ ptype: int(0) class(case_data2$period)[1] "character"5.3 Tips and Tricks for Unfamiliar Error Messages
If you are unfamiliar with an error message, and can’t figure out what the problem is by checking for misspellings, missing objects, or other common errors, try checking the class of your variables with class() or str(). For shorthand, if you are trying to do something with math, it probably won’t work if your variable is class “Character” (letters instead of numbers). There are other class mismatching issues out there (particularly with Factors) but that is always a good first one to check.
If the class or another simple error isn’t the problem, try copying and pasting the error message into google, along with the letter “R”. Try to only copy the general parts of the message, not parts that include the name of your dataset or variables, as they will be different from anything else that other people have solved online. (Example: if your error message says “can’t find object case_data2, object does not exist”, don’t include case_data2, just write “R can’t find object, object does not exist”)
The first results will often be from stackoverflow.com, which is a great resource, but there are almost always multiple versions of the same question, and multiple answers that work for each one. Take a good long look at the answers for each question, scrolling further down the page to see past the first solution, and see if the suggested solutions work in your code (make sure to always use your own datasets/file names when using suggested answers). If they don’t work for you, try looking at a related question.
There is almost always somebody who has had the problem you are having before in some fashion, even if it was with different data or for a different purpose. In rare cases, you could come across a totally original problem, and for that, we can make an account on stackoverflow.com to ask new questions. This can be a slow and frustrating process (people get very snarky about how you have to post your data in order to get an answer: see below)
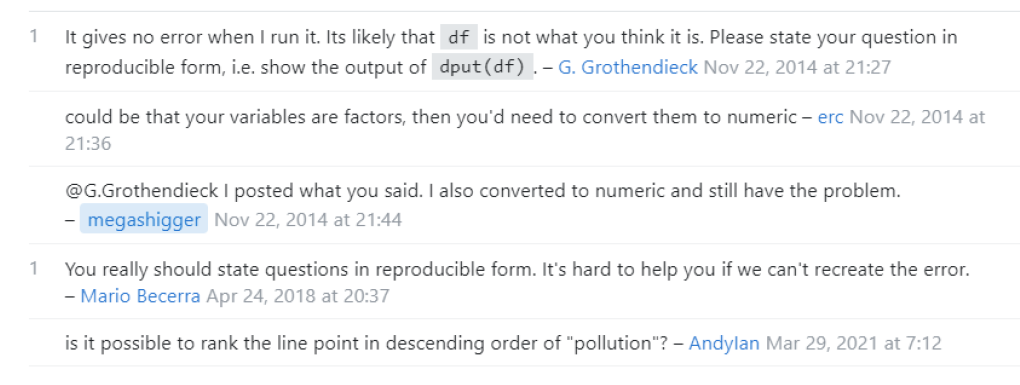
so it is usually better to find a previous related answer, but we can go through how to post reproducible data questions in future lessons.